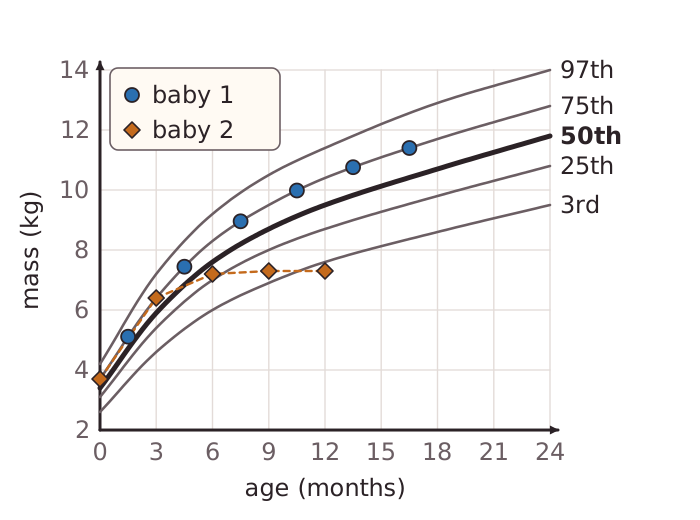
Doctors use percentile charts to monitor the growth of babies and children. A measurement such as mass, length or height is plotted against age, and the chart shows a set of curved lines called percentile lines.
A percentile tells you how a child compares with 100 children of the same age. A child on the 75th percentile for mass is heavier than 75 out of every 100 children of that age, so 25 are heavier. The 50th percentile line is the middle line: half of children of that age are above it and half are below it.
One measurement does not say much. A child on a low or high line can be perfectly healthy if they follow the same line, which shows a steady rate of growth. Doctors compare measurements over time. A sudden drop across several lines may be a sign of a health problem, such as poor nutrition or illness.
Growth can also be given as a percentage change in mass: percentage gain = change in mass ÷ original mass × 100. A baby whose mass rises from 4.0 kg to 4.4 kg has gained 0.4 kg, which is a gain of 10%.