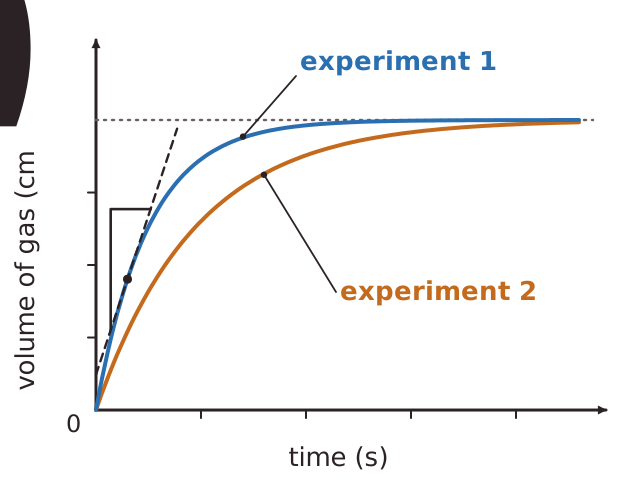
The progress of a reaction is often plotted as a graph of the mass or volume of a product against time. A graph of a reactant would show its mass or concentration against time, and the line goes down instead of up.
The line is steepest at the start, because the reactants are at their highest concentration and the rate is greatest. The line gets less steep as the reactants are used up. When the line becomes flat, the reaction has finished because one reactant has run out.
The steepness, or gradient, of the line measures the rate. A steeper line means a higher rate. To find the mean rate, divide the change in quantity by the time. If 48 cm3 of gas is made in 16 s, the mean rate is 48 ÷ 16 = 3 cm3/s. To find the rate at one moment, draw a tangent to the curve at that point. Its gradient is the change up the vertical axis divided by the change along the horizontal axis.
To compare two experiments, look at the two lines. The steeper line is the faster reaction. If both lines level off at the same height, the same amount of reactant was used up, so the same amount of product was made.