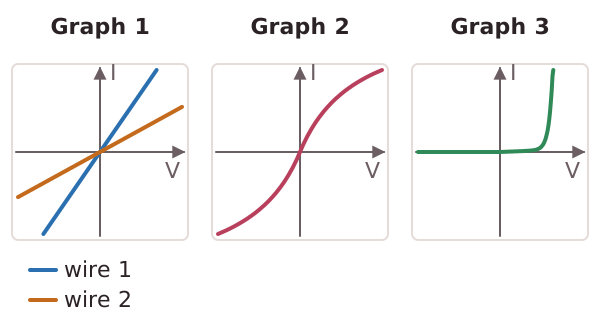
An I-V characteristic is a graph of the current through a component against the potential difference (p.d.) across it. To collect the data, connect the component in series with a cell, a variable resistor and an ammeter, and connect a voltmeter in parallel across the component. Change the variable resistor to alter the p.d., and record the current at each setting. Swap the connections to the cell to get readings for the p.d. in the opposite direction, and plot them as negative values.
The graph shows whether the component is linear or non-linear. A linear component gives a straight line through the origin. The current is directly proportional to the p.d., so the resistance, found from R = V ÷ I, is constant. For example, 6.0 V with 0.50 A gives R = 6.0 ÷ 0.50 = 12 ohms at every point on the line. A fixed resistor, or a wire kept at a constant temperature, behaves like this. A steeper line means a lower resistance, because the same p.d. produces a bigger current.
A non-linear component gives a curve. The ratio V ÷ I changes as the p.d. changes, so the resistance is not constant. Filament lamps, diodes, thermistors and LDRs all give curves or other non-straight graphs.
To make the investigation reliable, repeat the readings, take care not to let a wire heat up, and use a suitable range of p.d. values.