A straight-line graph has the equationy = mx + c where m is the gradient (Δy ÷ Δx) and c is the y-intercept (the value of y when x = 0). If y is directly proportional to x, then c = 0 and the graph is a straight line through the origin.To test a relationship, rearrange its equation into the form y = mx + c. Whatever is in the y position is plotted on the y-axis, whatever is in the x position on the x-axis, and the gradient and intercept then give the constants.Examples:
• v = u + at: plot v against t. Gradient = a, intercept = u.
• V = ε − Ir (terminal p.d. of a cell): plot V against I. Gradient = −r, intercept = ε.
• T = 2π√(L/g), which squares to T2 = (4π2/g)L: plot T2 against L. The line passes through the origin with gradient 4π2/g.Worked example: A graph of T2 against L has a gradient of 4.02 s2 m−1.g = 4π2 ÷ gradient = 39.48 ÷ 4.02 = 9.82 m s−2 Plotting T against L directly would give a curve, from which g is hard to find; choosing variables that give a straight line makes it easy to check the relationship (are the points on a line?) and to find constants from the gradient and intercept. Remember that the gradient has units: the y-axis unit divided by the x-axis unit.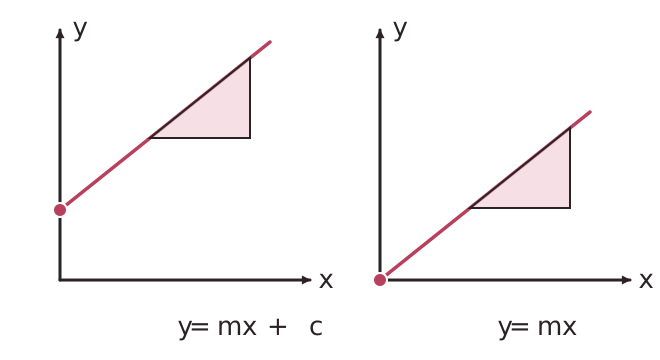
• v = u + at: plot v against t. Gradient = a, intercept = u.
• V = ε − Ir (terminal p.d. of a cell): plot V against I. Gradient = −r, intercept = ε.
• T = 2π√(L/g), which squares to T2 = (4π2/g)L: plot T2 against L. The line passes through the origin with gradient 4π2/g.Worked example: A graph of T2 against L has a gradient of 4.02 s2 m−1.