 BRAINCAKE
Best-fit and Worst-fit Lines
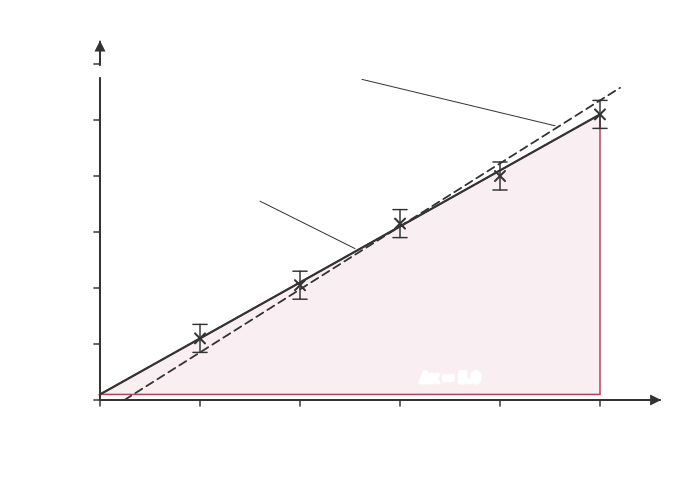
Once points and error bars are plotted, two straight lines are drawn.
The best-fit line is the straight line that best represents the data. It should pass through all the error bars, with the points scattered evenly on either side.
The worst-fit line is the steepest or the shallowest straight line that still passes through all the error bars. A steep worst-fit line is often drawn from the bottom of the first error bar to the top of the last; a shallow one from the top of the first to the bottom of the last. Check it still passes through every bar in between.
Sign in free to see the rest of this lesson, the R.E.C.I.P.E. recall steps and the quiz
BrainCake is free. Make an account in seconds and pick up where this page stops.
More in Measurements and Uncertainties
- Combining Uncertainties
- Uncertainties from Repeated Readings
- Plotting Graphs
- Error Bars
- Uncertainty in a Gradient and Intercept
- Straight-line Graphs y = mx + c
- Logarithmic Graphs
- Estimating Physical Quantities
All 12 lessons in Measurements and Uncertainties · All OCR AS-level Physics topics