Logarithms turn power-law and exponential relationships into straight-line graphs of the form y = mx + c. Here lg means log to base 10 and ln means log to base e.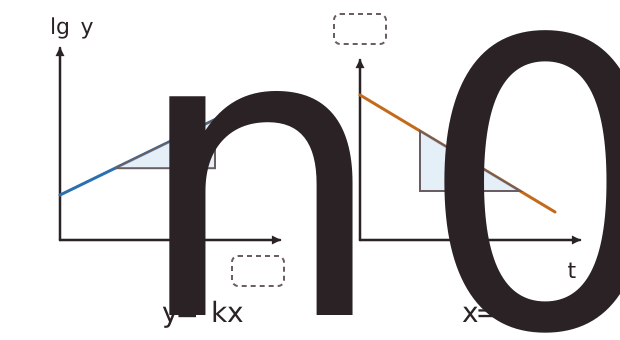 Power law, y = kxn: take lg of both sides.
lg y = n lg x + lg k Plot lg y against lg x. The graph is a straight line with gradient n and y-intercept lg k.Exponential, x = x0e−kt (for example, radioactive decay or capacitor discharge): take ln of both sides.ln x = −kt + ln x0 Plot ln x against t. The graph is a straight line with gradient −k and y-intercept ln x0.Worked example: A graph of lg y against lg x is a straight line with gradient 0.50 and y-intercept 0.30.
• n = gradient = 0.50, so y is proportional to √x.
• lg k = 0.30, so k = 100.30 = 2.0.
So y = 2.0x0.5.A log of a quantity has no units, so axes are labelled like lg (T / s) or ln (V / V). A lg-lg graph is also useful when the data cover several powers of ten, because it spreads the values out evenly. If the lg-lg graph is not a straight line, the relationship is not a simple power law.
Power law, y = kxn: take lg of both sides.• n = gradient = 0.50, so y is proportional to √x.
• lg k = 0.30, so k = 100.30 = 2.0.
So y = 2.0x0.5.A log of a quantity has no units, so axes are labelled like lg (T / s) or ln (V / V). A lg-lg graph is also useful when the data cover several powers of ten, because it spreads the values out evenly. If the lg-lg graph is not a straight line, the relationship is not a simple power law.