 BRAINCAKE
Error Bars
Error bars show the uncertainty in plotted values. Each bar is a line through the point, extending the same distance above and below it (or left and right) equal to the absolute uncertainty in that value. Short caps are drawn at the ends.
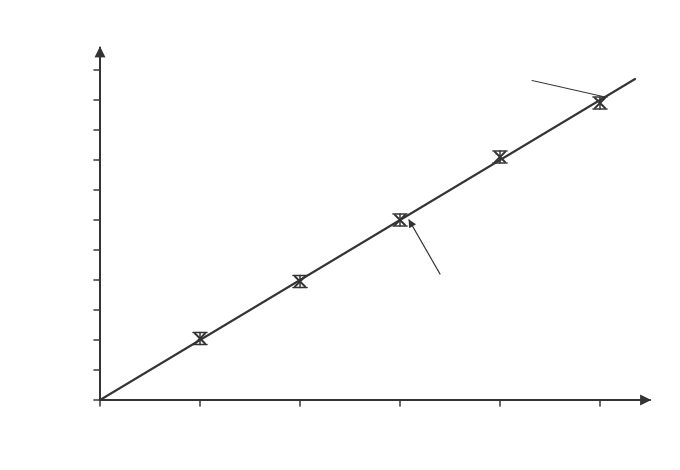
Worked example: A spring's extension is 12.0 cm with an uncertainty of ±0.4 cm (for example, half the range of repeated readings). The vertical error bar runs from 11.6 cm to 12.4 cm, so its total length is 0.8 cm on the y-axis scale.
Sign in free to see the rest of this lesson, the R.E.C.I.P.E. recall steps and the quiz
BrainCake is free. Make an account in seconds and pick up where this page stops.
Key terms in this lesson
- absolute uncertainty
- The uncertainty in a measurement, expressed with the same units as the measurement itself.
- best-fit line
- The straight line or smooth curve on a graph that best represents the trend of the plotted data points.
More in Measurements and Uncertainties
- Absolute and Percentage Uncertainty
- Combining Uncertainties
- Uncertainties from Repeated Readings
- Plotting Graphs
- Best-fit and Worst-fit Lines
- Uncertainty in a Gradient and Intercept
- Straight-line Graphs y = mx + c
- Logarithmic Graphs
All 12 lessons in Measurements and Uncertainties · All OCR AS-level Physics topics