 BRAINCAKE
The Hertzsprung-Russell Diagram
The Hertzsprung-Russell (H-R) diagram is a graph of stars' luminosity against their surface temperature. Plotting many stars shows they fall into distinct groups.
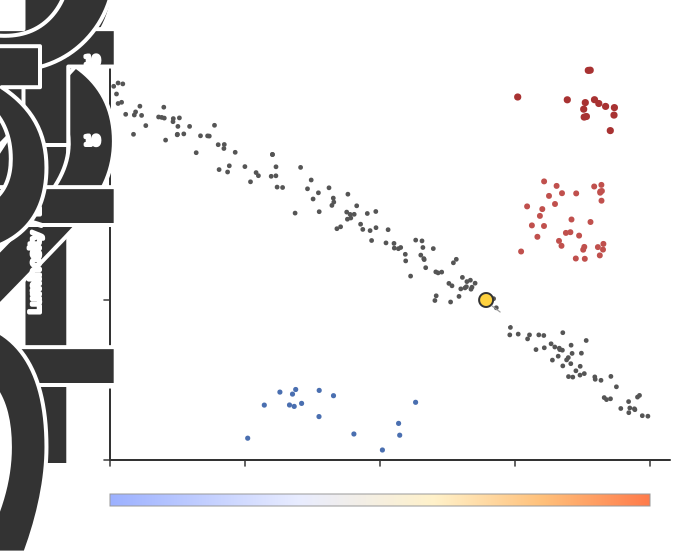
Features of the axes:
• luminosity on the vertical axis, usually relative to the Sun (LSun = 1), on a logarithmic scale from about 10−4 to 106
• surface temperature on the horizontal axis, also logarithmic, decreasing from left to right (about 40 000 K down to 2500 K)
Sign in free to see the rest of this lesson, the R.E.C.I.P.E. recall steps and the quiz
BrainCake is free. Make an account in seconds and pick up where this page stops.
Key terms in this lesson
- main sequence
- The stable, longest stage of a star's life in which it fuses hydrogen into helium in its core, forming a diagonal band on the Hertzsprung-Russell diagram.
- red giant
- A cool, highly luminous, greatly expanded star formed when a low-mass star's core contracts and hydrogen fuses in a shell around it.
- red supergiant
- A very large, extremely luminous, cool star formed when a high-mass star's outer layers swell as its core fuses progressively heavier elements.
- white dwarf
- The small, extremely dense, hot core left behind after a low-mass star sheds its outer layers, no longer undergoing fusion.
More in Space
- Wien's Law
- Luminosity and Intensity
- The Inverse Square Law for Intensity
- Estimating Stellar Radius and Temperature
- Formation of a Star
- Life Cycle of a Star
- White Dwarfs, Neutron Stars and Black Holes
- Trigonometric Parallax
All 18 lessons in Space · All Edexcel A-level Physics topics