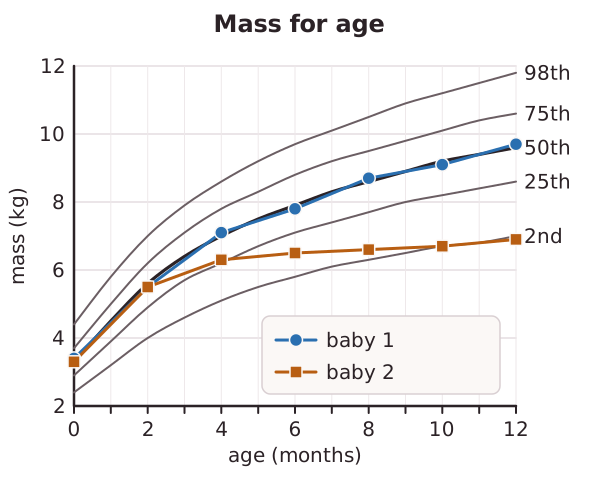
A percentile chart shows how a child's measurement compares with those of many other children of the same age and sex. Doctors use charts for mass, length (or height) and head circumference. Each curved line on the chart is a percentile.
The 50th percentile line is the median. A baby on the 50th percentile is heavier than 50 out of every 100 babies of the same age and sex, and lighter than the other 50. A baby on the 25th percentile is heavier than 25 out of every 100 babies and lighter than 75 out of 100.
A baby is measured at regular intervals and each result is plotted as a point. A healthy child usually follows roughly the same percentile line as they grow, which is steady growth. A sudden jump or fall across several percentile lines may be a sign of a health problem, so the doctor looks into it.
Growth can also be given as a percentage change. Percentage gain in mass = (change in mass ÷ original mass) × 100. A baby whose mass rises from 5.0 kg to 6.0 kg has gained 1.0 kg, which is (1.0 ÷ 5.0) × 100 = 20%.