 BRAINCAKE
Pyramid of Numbers
A pyramid of numbers shows the number of individual organisms at each trophic level in a food chain, in a given area at one time. The width of each bar is proportional to the number of organisms.
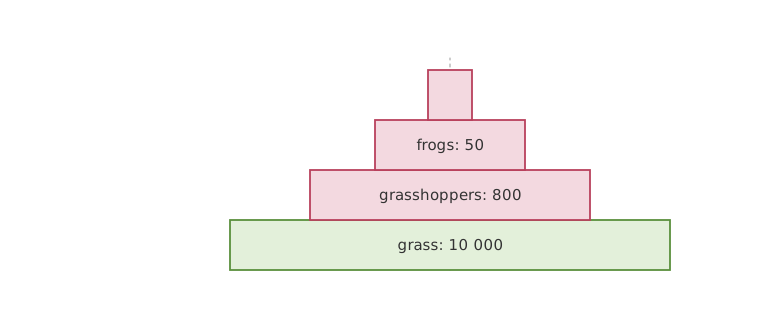
To construct one:
1. Sample the habitat, for example with quadrats, nets and traps, and count the individuals at each trophic level.
2. Scale the counts up to the whole area if needed.
3. Draw a bar for each level, with producers at the bottom and widths to scale.
Sign in free to see the rest of this lesson, the R.E.C.I.P.E. recall steps and the quiz
BrainCake is free. Make an account in seconds and pick up where this page stops.
More in The Efficiency of Ecosystems
- Food Chains
- Food Webs
- Ecological Pyramids
- Pyramid of Biomass
- Inverted Pyramids of Numbers
- Energy Losses in Producers
- Energy Losses between Consumers
- Efficiency of Energy Transfer
All 20 lessons in The Efficiency of Ecosystems · All Edexcel A-level Biology topics