A pedigree diagram (family tree) shows how a characteristic is inherited through several generations of a family. It is used to work out whether an allele is dominant or recessive, whether it is sex-linked, and the genotypes of family members.Standard symbols:• square = male, circle = female
• shaded symbol = affected by the condition, unshaded = unaffected
• a horizontal line joining a male and female = parents
• a vertical line down to a horizontal line of symbols = their children
• generations are labelled with Roman numerals (I, II, III) and individuals with numbers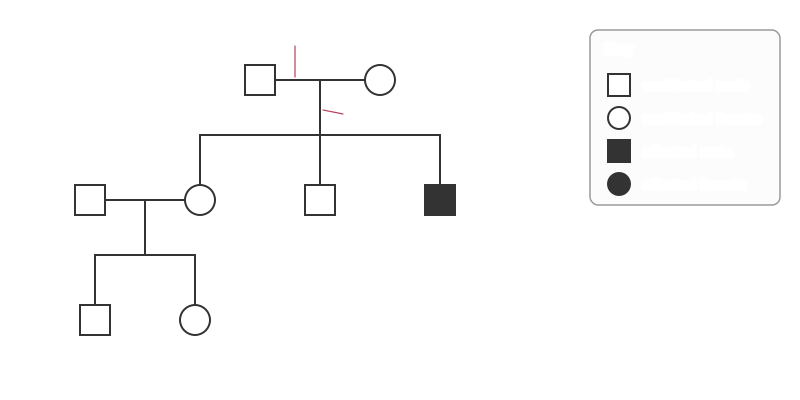
• If two affected parents have an unaffected child, the allele must be dominant.
• If an affected female has an unaffected son, the condition cannot be X-linked recessive, because her son would have received her only type of X.Worked example: in the diagram, individuals I-1 and I-2 are unaffected but their son II-3 is affected. The condition is therefore recessive. II-3 is aa, so I-1 and I-2 must both be Aa.Once the pattern is known, probabilities can be calculated for future children. Always explain a deduction by naming specific individuals in the diagram.
• shaded symbol = affected by the condition, unshaded = unaffected
• a horizontal line joining a male and female = parents
• a vertical line down to a horizontal line of symbols = their children
• generations are labelled with Roman numerals (I, II, III) and individuals with numbers
• If two affected parents have an unaffected child, the allele must be dominant.
• If an affected female has an unaffected son, the condition cannot be X-linked recessive, because her son would have received her only type of X.Worked example: in the diagram, individuals I-1 and I-2 are unaffected but their son II-3 is affected. The condition is therefore recessive. II-3 is aa, so I-1 and I-2 must both be Aa.Once the pattern is known, probabilities can be calculated for future children. Always explain a deduction by naming specific individuals in the diagram.