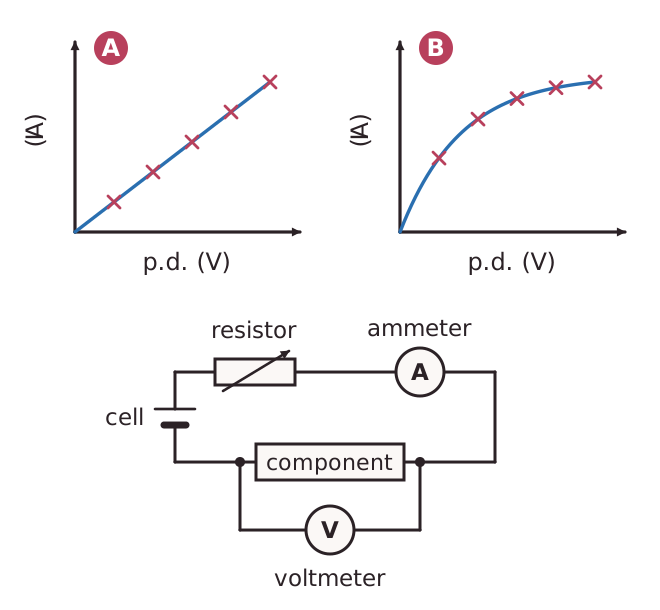
To find out how a component behaves, you plot a graph of current against potential difference (an I-V graph). You connect an ammeter in series with the component and a voltmeter in parallel across it. A variable resistor in the circuit, or a change in the number of cells, lets you collect a range of pairs of readings.
If the points lie on a straight line through the origin, the current is directly proportional to the potential difference. The component is linear and its resistance is constant. A fixed resistor, or a wire kept at a constant temperature, does this. For example, a linear component with 0.2 A at 1.0 V has 0.4 A at 2.0 V.
If the points form a curve, the component is non-linear. Its resistance changes as the current or potential difference changes. Filament lamps, diodes, thermistors and LDRs are non-linear. On an I-V graph, a steeper line means a lower resistance.