The molecules in a gas do not all have the same energy. At any moment, a few are moving slowly, most have a moderate energy, and a few have a very high energy. The Maxwell-Boltzmann distribution is a graph showing how the energies of the molecules in a sample of gas are spread out at a given temperature.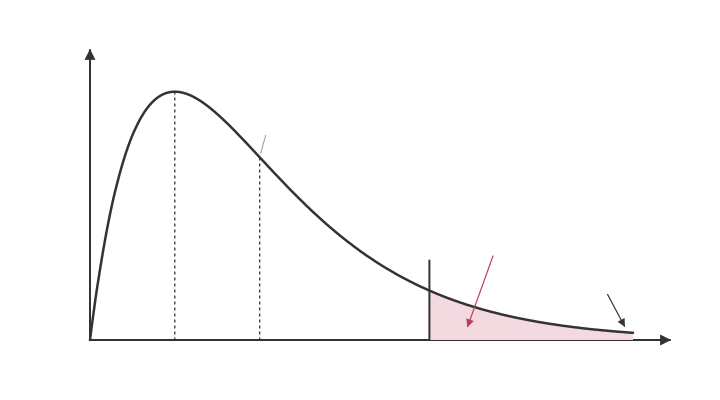
• The curve starts at the origin, because no molecules have zero energy.
• The peak shows the most probable energy, the energy that the largest number of molecules have. The mean energy is slightly to the right of the peak, because the curve is not symmetrical.
• At high energy the curve approaches the x-axis but never touches it, because there is no maximum energy.
• The area under the curve equals the total number of molecules in the sample.The activation energy, Ea, is marked on the energy axis, usually well to the right of the peak. Only molecules with energy greater than or equal to Ea can react when they collide. The number of these molecules is the area under the curve to the right of Ea. For most reactions this is only a small fraction of the total, which is why only a small fraction of collisions are successful.The distribution is used in the following lessons to explain the effects of temperature and catalysts on rate.
• The curve starts at the origin, because no molecules have zero energy.
• The peak shows the most probable energy, the energy that the largest number of molecules have. The mean energy is slightly to the right of the peak, because the curve is not symmetrical.
• At high energy the curve approaches the x-axis but never touches it, because there is no maximum energy.
• The area under the curve equals the total number of molecules in the sample.The activation energy, Ea, is marked on the energy axis, usually well to the right of the peak. Only molecules with energy greater than or equal to Ea can react when they collide. The number of these molecules is the area under the curve to the right of Ea. For most reactions this is only a small fraction of the total, which is why only a small fraction of collisions are successful.The distribution is used in the following lessons to explain the effects of temperature and catalysts on rate.