Cooling curves correct for heat loss to the surroundings. The temperature of the reactants is measured at 30 second intervals until the temperature stays constant. The reactants are then added together and the temperature is measured every 30 seconds until the temperature has fallen for several minutes.A graph of temperature against time is plotted. To correct for cooling the curve is extrapolated back to the time the reactants were mixed together.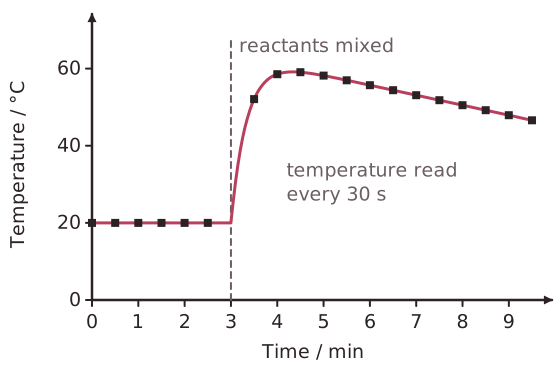 The reactants, products and apparatus are left to stand for some time to ensure they all reach the same temperature and the temperature of the surroundings.The procedure is as follows:Place 50cm3 of each solution in two different polystyrene cups and taking readings of the temperature of each solution every 30s for 4 minutes to confirm the temperature is stable.Then one solution is poured into the other and the temperature change measured every 30seconds for 6minutes.On mixing the temperature rises rapidly then decreases slowly. Although polystyrene is a good insulator, heat is lost from the polystyrene cup. A line of best fit is drawn through the points and extrapolated back to the time of mixing.