 BRAINCAKE
Integration Traces
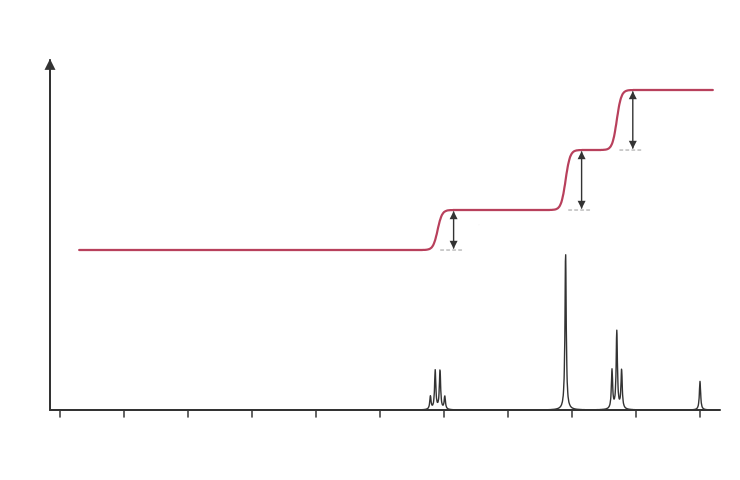
In a 1H NMR spectrum, the area under each peak is proportional to the number of H atoms in that environment. Peak heights can be misleading, because peaks have different widths and may be split, so spectrometers draw an integration trace.
The integration trace is a line that runs across the spectrum and rises in a step over each peak. The height of each step is proportional to the area of the peak below it, and so to the number of H atoms in that environment.
Sign in free to see the rest of this lesson, the R.E.C.I.P.E. recall steps and the quiz
BrainCake is free. Make an account in seconds and pick up where this page stops.
More in NMR Spectroscopy
- The TMS Standard
- Deuterated Solvents
- 13C NMR Spectroscopy
- Interpreting 13C NMR Spectra
- 1H NMR Spectroscopy
- Spin-Spin Splitting
- The n+1 Rule
- Interpreting 1H NMR Spectra
All 11 lessons in NMR Spectroscopy · All AQA A-level Chemistry topics