 BRAINCAKE
Electrical and Pressure Changes in the Heart
The electrical changes shown on an ECG cause the contractions of the heart, so they can be matched to the pressure changes in the chambers and arteries during one cardiac cycle. The graph shows pressure in the left atrium, left ventricle and aorta, with the ECG trace above on the same time axis.
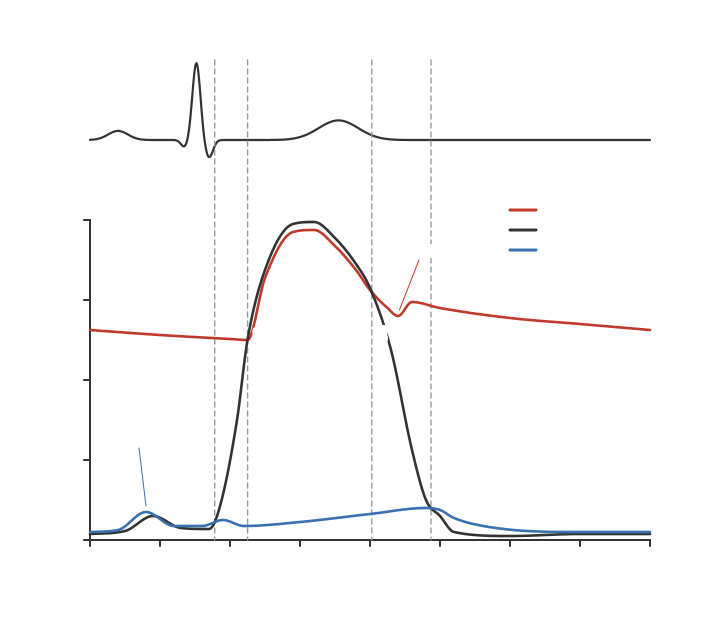
P wave → atrial systole. Shortly after the P wave, the atria contract, giving a small rise in pressure in the atria. This pushes the last of the blood into the ventricles.
Sign in free to see the rest of this lesson, the R.E.C.I.P.E. recall steps and the quiz
BrainCake is free. Make an account in seconds and pick up where this page stops.
More in The Heart
- Structure of the Human Heart
- Blood Flow through the Heart
- Contraction of Cardiac Muscle
- The Cardiac Cycle
- Control of the Heartbeat
- Electrocardiograms
All 7 lessons in The Heart · All Edexcel AS-level Biology topics