 BRAINCAKE
Oxygen Dissociation Curve for Haemoglobin
An oxygen dissociation curve shows the percentage saturation of haemoglobin with oxygen (y-axis) at different partial pressures of oxygen, pO2 (x-axis). For haemoglobin the curve is S-shaped (sigmoid).
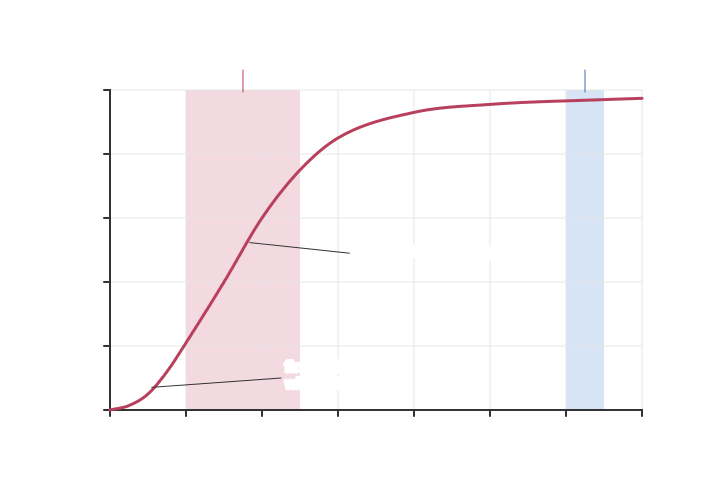
The shape is explained by cooperative binding:
Sign in free to see the rest of this lesson, the R.E.C.I.P.E. recall steps and the quiz
BrainCake is free. Make an account in seconds and pick up where this page stops.
More in Circulatory Systems
- Granulocytes
- Agranulocytes
- Platelets
- Haemoglobin and Oxygen Transport
- The Bohr Effect
- Fetal Haemoglobin
- Myoglobin
- Transport of Carbon Dioxide
All 33 lessons in Circulatory Systems · All Edexcel AS-level Biology topics