 BRAINCAKE
Standard Growth Curve
When bacteria are grown in a closed culture (nothing added and nothing removed after the start), the population follows a standard growth curve with four phases. Numbers are usually plotted on a log scale, because they rise so fast.
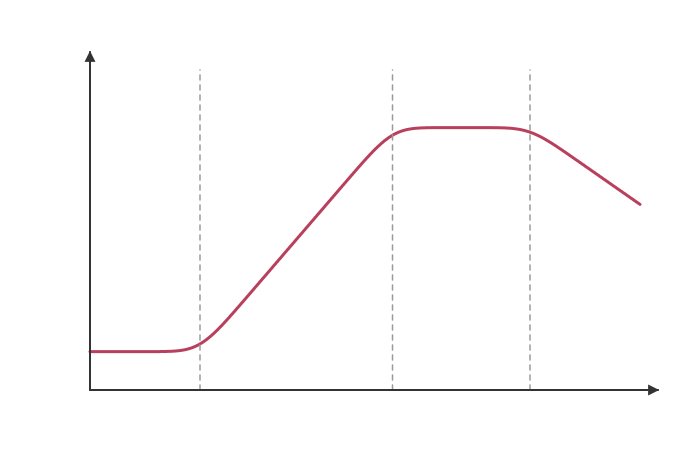
1. Lag phase: little increase in numbers. The bacteria are adapting to the new conditions: taking up water, and synthesising the enzymes and other molecules they need before they can divide.
Sign in free to see the rest of this lesson, the R.E.C.I.P.E. recall steps and the quiz
BrainCake is free. Make an account in seconds and pick up where this page stops.
More in Cloning and Biotechnology
- Microorganisms in Medicine and Bioremediation
- Culturing Microorganisms
- Aseptic Technique
- Serial Dilution
- Batch Fermentation
- Continuous Fermentation
- Controlling Conditions in Fermenters
- Immobilised Enzymes
All 21 lessons in Cloning and Biotechnology · All OCR A-level Biology topics