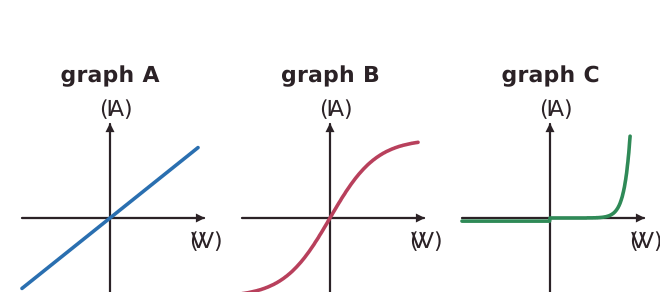
For some components the resistance stays constant, and for others it changes. An ohmic conductor, such as a fixed resistor at constant temperature, has a current that is directly proportional to the potential difference across it. This means its resistance remains constant as the current changes, and its graph of current against potential difference is a straight line through the origin. A graph that is a straight line is linear, and a graph that is a curve is non-linear.
The resistance of a filament lamp increases as the temperature of the filament increases. As more current flows, the filament gets hotter, so its graph is a curve that flattens. A diode lets current flow in one direction only and has a very high resistance in the reverse direction, so almost no current flows that way. The resistance of a thermistor decreases as the temperature increases, which makes it useful in a thermostat to switch heating on and off. The resistance of an LDR decreases as light intensity increases, so its resistance is high in the dark. It can be used in a circuit that switches lights on when it gets dark.
To measure the resistance of a component, connect an ammeter in series with it and a voltmeter in parallel across it. Read the current and the potential difference, then divide potential difference by current. A variable resistor in the circuit lets you change the current and take a range of readings. In required practical 4, you plot current against potential difference for a resistor at constant temperature, a filament lamp and a diode, and the shape of each graph shows whether it is linear or non-linear.