A
force-extension graph shows how the extension of a sample changes as the tensile force on it increases. A
force-compression graph is the same idea for a compressive force, plotting force against the reduction in length.
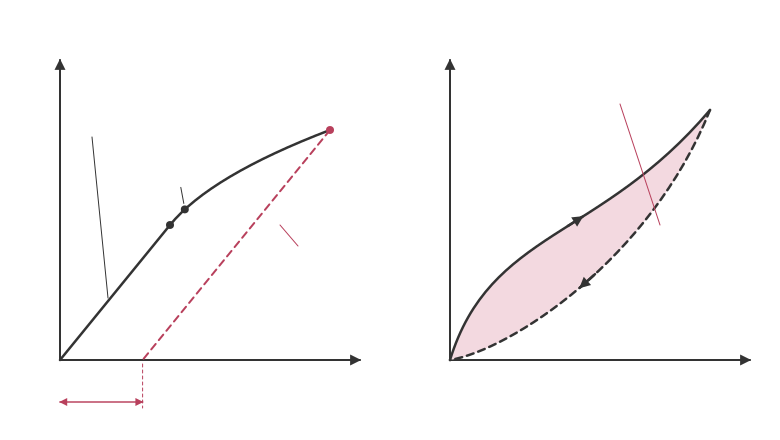
For a spring or metal wire the graph starts as a
straight line through the origin: force is proportional to extension, so Hooke's law is obeyed. The gradient of this section is the stiffness:
k = ΔF ÷ ΔxA steeper line means a stiffer sample.
The straight section ends at the
limit of proportionality, and just beyond it is the
elastic limit. Up to the elastic limit the deformation is elastic: when the force is removed the sample returns to its original length and the unloading line retraces the loading line.
Beyond the elastic limit the deformation is
plastic. When the load is removed, a metal unloads along a line parallel to the original straight section, so the line does not return to the origin and a permanent extension remains.
For a rubber band the loading and unloading curves are different and form a loop, called
hysteresis. The area inside the loop is the energy transferred to thermal energy in the rubber in one cycle.
The area under any force-extension graph equals the work done on the sample.
Example: a spring extends 0.030 m under a force of 6.0 N, so k = 6.0 ÷ 0.030 = 200 N m
-1.