 BRAINCAKE
The Hertzsprung-Russell Diagram
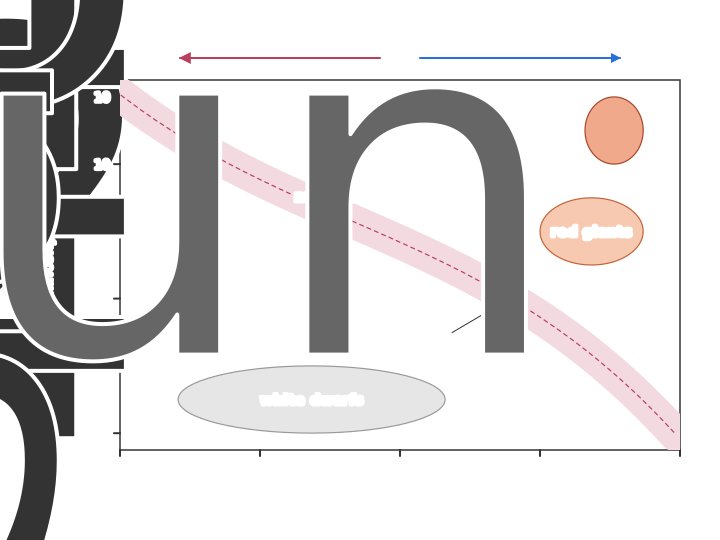
The Hertzsprung-Russell (HR) diagram is a graph of the luminosity of stars (vertical axis) against their surface temperature (horizontal axis). It is used to classify stars and to show how they evolve.
The axes have two unusual features:
• temperature increases to the left, from about 3000 K on the right to about 40 000 K on the left;
• both axes use logarithmic scales, because the luminosities of stars range from about 10−4 to 106 times the Sun's luminosity (L☉).
Sign in free to see the rest of this lesson, the R.E.C.I.P.E. recall steps and the quiz
BrainCake is free. Make an account in seconds and pick up where this page stops.
Key terms in this lesson
- luminosity
- The total radiant power emitted by a star, measured in watts.
More in Astrophysics and Cosmology
- Evolution of a Low-Mass Star
- Evolution of a Massive Star
- White Dwarfs and the Chandrasekhar Limit
- Neutron Stars and Black Holes
- Energy Levels in Atoms
- Emission and Absorption Line Spectra
- Using Diffraction Gratings to Analyse Starlight
- Wien's Displacement Law
All 24 lessons in Astrophysics and Cosmology · All OCR A-level Physics topics