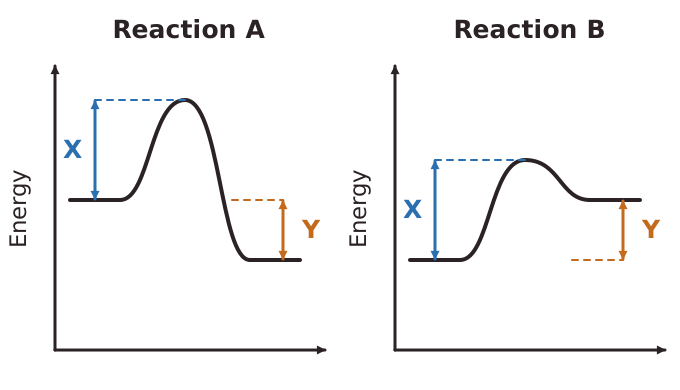
A reaction profile is a graph that shows how the energy of the chemicals changes during a reaction. The vertical axis is energy. The horizontal axis is the progress of the reaction, from reactants on the left to products on the right. The reactants are drawn as a horizontal line at their energy level, and the products as another horizontal line at their energy level.
Between the two lines the curve rises to a peak and then falls. The height from the reactants up to the peak is the activation energy. The difference in height between the reactants and the products is the overall energy change of the reaction.
For an exothermic reaction the products are at a lower energy than the reactants, so the line ends lower than it started. The energy difference is transferred to the surroundings. For an endothermic reaction the products are at a higher energy than the reactants, so the line ends higher than it started. That extra energy was taken in from the surroundings.
When you draw a profile, label the axes, label the reactants and the products, show the activation energy as an arrow from the reactants up to the peak, and show the overall energy change as an arrow between the reactant level and the product level.