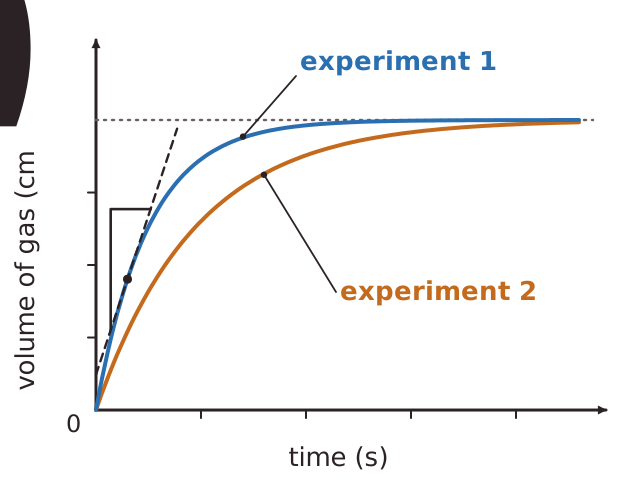
A rate graph usually plots the amount of product, such as the volume of gas, against time. The line is steepest at the start, when the reactants are at their highest concentration. It then gets less steep as the reactants are used up, and it goes flat when one reactant has run out and the reaction has finished.
The gradient of the line shows the rate. A steeper line means a faster reaction. The average rate is the change in the amount of product divided by the time taken. For example, 40 cm3 of gas in 20 s gives an average rate of 40 / 20 = 2 cm3/s. To find the rate at one moment, draw a tangent to the curve at that point and work out its gradient.
When two experiments use the same amount of the limiting reactant, their lines level off at the same height, even if one is steeper than the other. The steeper line is the faster reaction, but both make the same total amount of product.
Sometimes you measure the time t for something to happen, such as a cross disappearing. A shorter time means a faster reaction and a higher rate, so the rate is proportional to 1/t. If t = 50 s, then 1/t = 0.02 /s. If t = 20 s, then 1/t = 0.05 /s, which is the faster reaction.