 BRAINCAKE
Mass Spectra of Elements
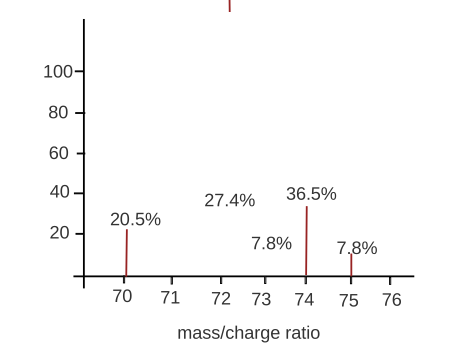
The mass spectrum of an element shows a separate peak for each isotope. The horizontal axis shows the mass to charge ratio (m/z) and the vertical axis shows the relative abundance. For ions with a 1+ charge, the m/z value is equal to the relative isotopic mass.
Sign in free to see the rest of this lesson, the R.E.C.I.P.E. recall steps and the quiz
BrainCake is free. Make an account in seconds and pick up where this page stops.
Key terms in this lesson
- Relative atomic mass
- The weighted mean mass of an atom of an element compared to 1/12th the mass of a carbon-12 atom.
More in Atomic Structure
- Electrons
- Electron Shells
- The Mass Spectrometer
- Time of Flight Mass Spectrometer
- Low Resolution Mass Spectrometry
- Mass Spectrometer in Space
- Quantum Mechanics
- Energy Levels
All 22 lessons in Atomic Structure · All AQA AS-level Chemistry topics