 BRAINCAKE
The Oxygen Dissociation Curve
An oxygen dissociation curve shows the percentage saturation of haemoglobin with oxygen (y-axis) against the partial pressure of oxygen, pO2, in kPa (x-axis). For adult haemoglobin the curve is sigmoid (S-shaped).
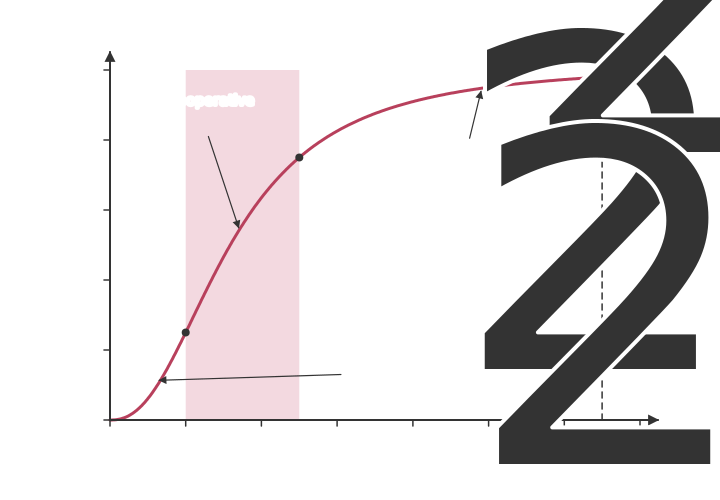
The S-shape is explained by cooperative binding:
Sign in free to see the rest of this lesson, the R.E.C.I.P.E. recall steps and the quiz
BrainCake is free. Make an account in seconds and pick up where this page stops.
Key terms in this lesson
- partial pressure
- The pressure that a particular gas in a mixture would exert if it alone occupied the whole volume.
More in Transport in Animals
- Aortic Aneurysms
- Red Blood Cells
- Haemoglobin
- Oxygen Loading and Unloading
- Partial Pressure of Oxygen
- The Bohr Effect
- Fetal Haemoglobin
- Transport of Carbon Dioxide
All 32 lessons in Transport in Animals · All OCR AS-level Biology topics