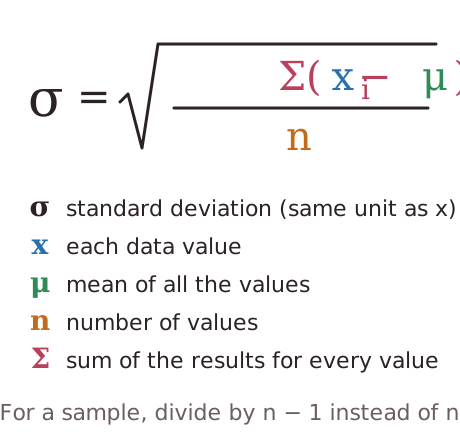
Standard deviation measures how spread out data is and is a measure of the amount of variation in a data set.The greater the standard deviation, the greater the spread of the data and the greater the amount of variation.Standard deviation is given by:
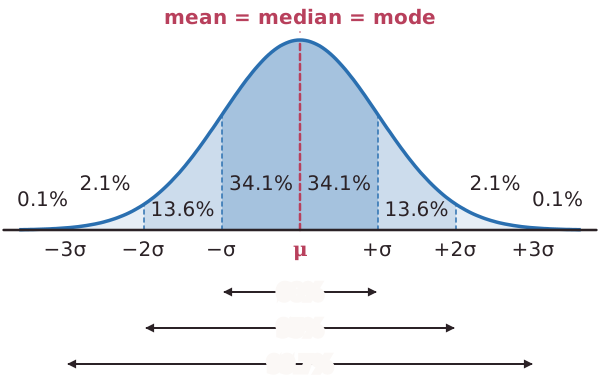
68% of all values fall within ±1 standard deviation from the mean.95% of all values fall within ±2 standard deviations from the mean.99.7% of all values fall within ±3 standard deviations from the mean.
Standard Deviation
Read the text
Read the text and highlight anything you think is important. When you go on, the text is hidden and you answer from memory.
Specification: OCR Biology A (H020), AS-level, 4.2.2 Classification and evolution. Topic: Classification and Evolution.
Key terms in this lesson
- disulfide bridge
- A covalent bond formed between two cysteine residues that helps stabilise the tertiary or quaternary structure of a protein.
- tertiary structure
- The overall three-dimensional shape of a single polypeptide chain, formed and held by bonds between R groups.
- glycoprotein
- A protein with a carbohydrate chain attached, often found on the cell surface acting as a receptor or antigen.
- pathogen
- A microorganism that causes disease.
- antigen
- A molecule, usually a protein, on the surface of a cell or pathogen that triggers an immune response.
More in Classification and Evolution
- Environmental Causes of Variation
- Discontinuous Variation
- Continuous Variation
- Normal Distribution
- Student T-test
- Spearman's Rank Correlation Coefficient
- Adaptations
- Anatomical Adaptations
All 36 lessons in Classification and Evolution · All OCR AS-level Biology topics