 BRAINCAKE
Normal Distribution
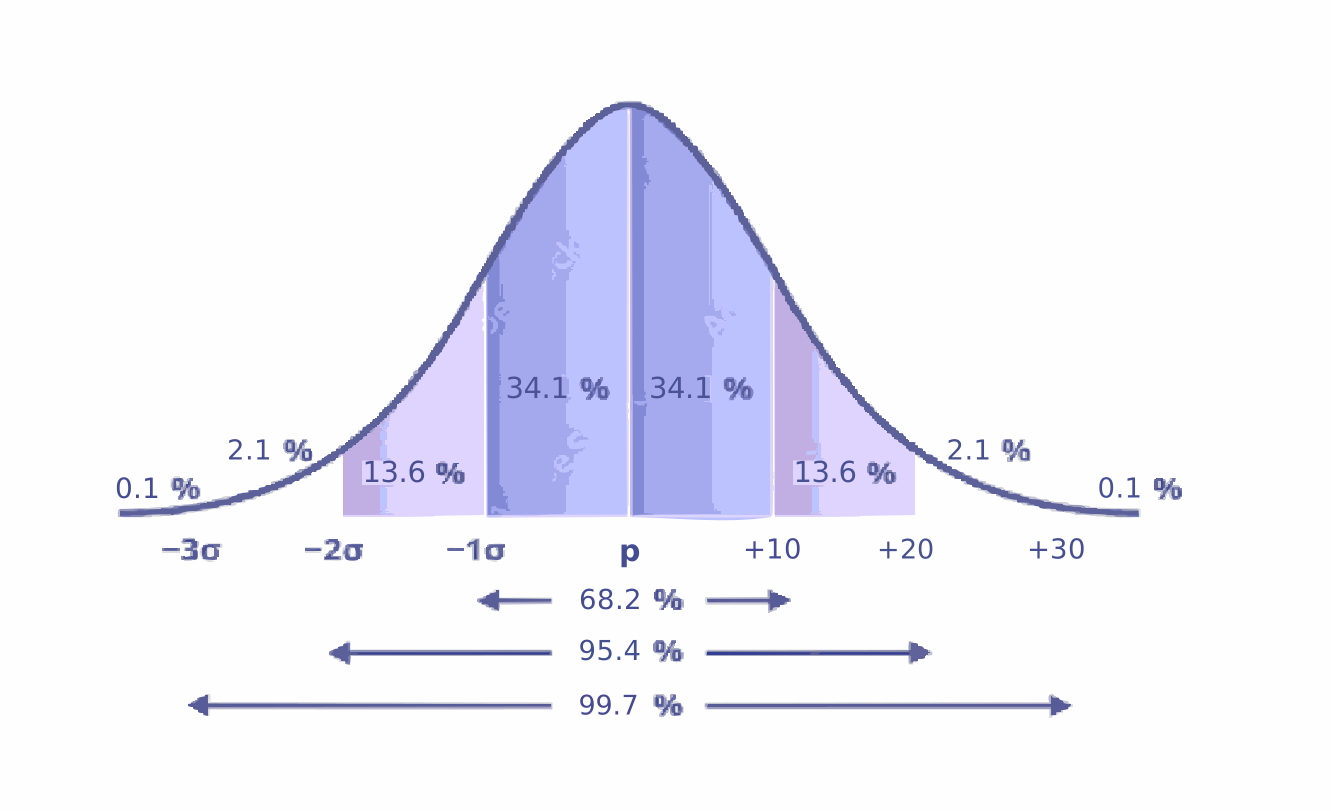
A normal distribution curve is a continuous line graph that is symmetrical about the mean.
It takes the shape of a bell-shaped curve.
Plotting data from continuous variation on a graph usually results in a normal distribution curve.
Sign in free to see the rest of this lesson, the R.E.C.I.P.E. recall steps and the quiz
BrainCake is free. Make an account in seconds and pick up where this page stops.
More in Classification and Evolution
- Genetic Causes of Variation - Meiosis and Chance
- Environmental Causes of Variation
- Discontinuous Variation
- Continuous Variation
- Standard Deviation
- Student T-test
- Spearman's Rank Correlation Coefficient
- Adaptations
All 36 lessons in Classification and Evolution · All OCR AS-level Biology topics