 BRAINCAKE
Interpreting Limiting Factor Graphs
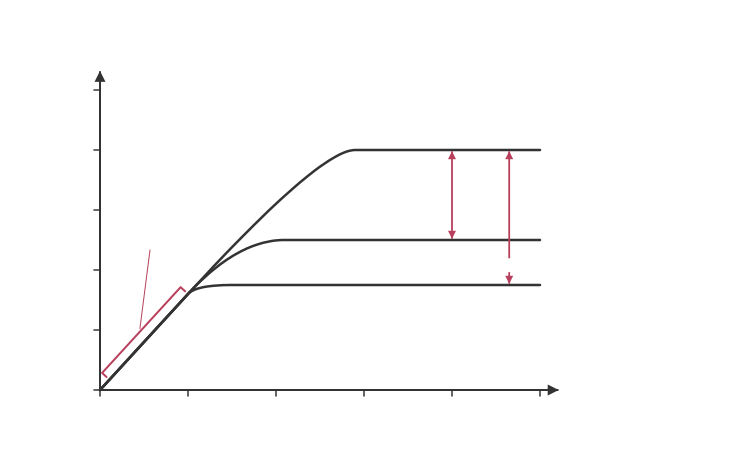
Exam questions often show several curves on one graph, each measured under different conditions. The key skill is deciding which factor is limiting at each point.
Use two rules:
1. Where a curve is rising, the factor on the x-axis is limiting, because increasing it increases the rate.
2. Where a curve has levelled off, the x-axis factor is no longer limiting. Compare curves: the factor that differs between two plateaus was limiting the lower one.
Sign in free to see the rest of this lesson, the R.E.C.I.P.E. recall steps and the quiz
BrainCake is free. Make an account in seconds and pick up where this page stops.
More in Energy for Biological Processes
- Limiting Factors of Photosynthesis
- Light Intensity as a Limiting Factor
- Carbon Dioxide Concentration as a Limiting Factor
- Temperature as a Limiting Factor
- Effect of Limiting Factors on the Calvin Cycle
- Uses of Triose Phosphate
- Investigating the Rate of Photosynthesis
- Agricultural Glasshouses and Limiting Factors
All 17 lessons in Energy for Biological Processes · All AQA A-level Biology topics