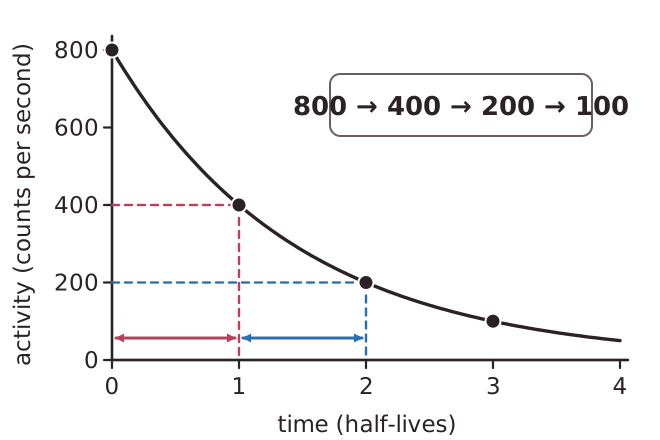
Each half-life halves the activity again. After 1 half-life one half of the original activity is left. After 2 half-lives one quarter is left, after 3 half-lives one eighth, and after 4 half-lives one sixteenth. After n half-lives the activity has fallen to 1 part in 2n of the original.
We can give this net decline as a ratio of final activity to original activity. For example, a source starts at 800 counts per second. After 1 half-life it is 400, after 2 half-lives it is 200 and after 3 half-lives it is 100. The activity is halved each time, so the ratio of final to original is 100 : 800, which simplifies to 1 : 8.
On a half-life graph the activity (or count rate) is plotted against time. The curve falls steeply at first and then flattens out. To find the half-life, pick any activity value, read off the time at which the activity has fallen to half of it, and find the difference between the two times. The answer is the same wherever you start on the curve.