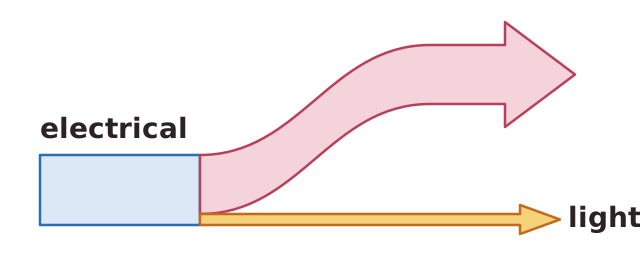
An energy transfer diagram shows where energy goes in a change. The simplest kind uses arrows between boxes, for example chemical store, arrow, kinetic store. A Sankey diagram goes further: the width of each arrow is drawn to scale to show the amount of energy.
In a Sankey diagram the input arrow is on the left. The useful output carries straight on, and the wasted energy splits off to the side. The widths of the outputs add up to the width of the input, because energy is conserved. If 1 mm of width stands for 10 J, then an input of 250 J is drawn 25 mm wide.
Worked examples: a lamp takes in 100 J of electrical energy and transfers 20 J as light, so the wasted energy is 100 - 20 = 80 J, which goes to the thermal store of the surroundings. A motor takes in 500 J and transfers 350 J usefully, so 150 J is wasted.