 BRAINCAKE
Uncertainties on Graphs
Uncertainties in plotted data are shown on a graph with error bars. An error bar is a line drawn through a plotted point that extends by the absolute uncertainty in each direction, usually with a short cap at each end. If both variables have significant uncertainties, error bars are drawn both vertically and horizontally; if one uncertainty is too small to show on the scale, that bar is left out.
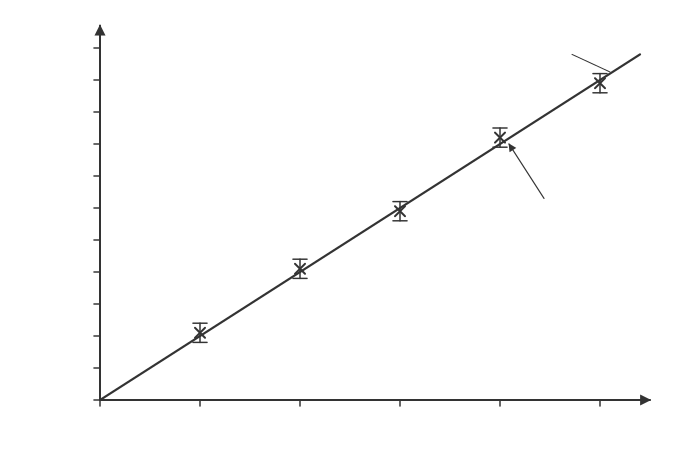
Example: A point is plotted at I = 2.0 A, V = 8.2 V, and the uncertainty in V is ±0.3 V. The vertical error bar runs from 7.9 V to 8.5 V, a total length of 0.6 V on the scale.
Sign in free to see the rest of this lesson, the R.E.C.I.P.E. recall steps and the quiz
BrainCake is free. Make an account in seconds and pick up where this page stops.
More in Measurements and Errors
- Converting Units
- Random and Systematic Errors
- Precision, Repeatability and Reproducibility
- Resolution and Accuracy
- Absolute, Fractional and Percentage Uncertainty
- Combining Uncertainties
- Uncertainty in a Gradient
- Estimation and Orders of Magnitude
All 12 lessons in Measurements and Errors · All AQA AS-level Physics topics