 BRAINCAKE
N-Z Graph
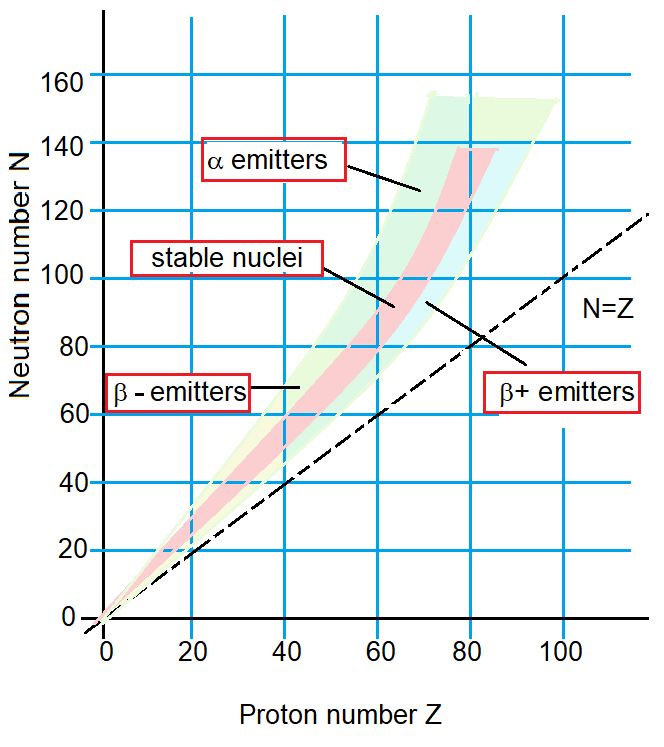
If a graph of neutron number against proton number is plotted for all known isotopes of the elements it shows a line curving upwards and deviating from the line N=Z.
Sign in free to see the rest of this lesson, the R.E.C.I.P.E. recall steps and the quiz
BrainCake is free. Make an account in seconds and pick up where this page stops.
More in Radioactivity
- Argon dating
- Radioactive Tracers
- Thickness Monitoring and Engine Wear
- Power Sources
- Decay Series
- Energy Levels
- Technetium
- Electron Diffraction
All 25 lessons in Radioactivity · All AQA A-level Physics topics