 BRAINCAKE
The Hertzsprung-Russell Diagram
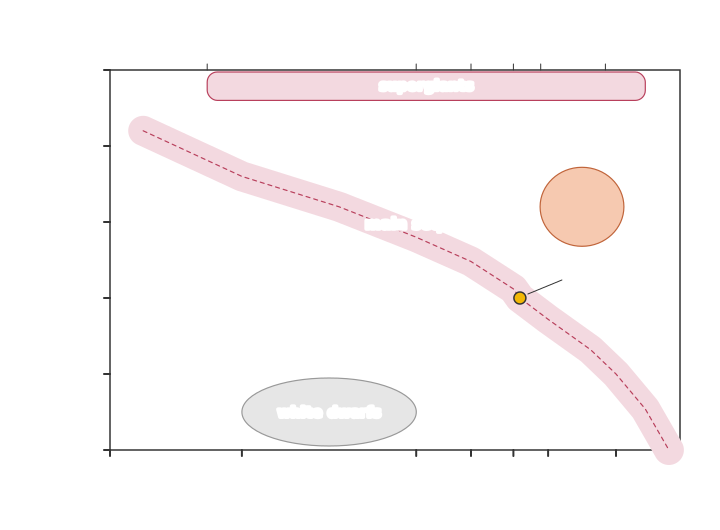
The Hertzsprung-Russell (HR) diagram is a plot of stars' absolute magnitude against their surface temperature (or spectral class).
Features of the axes:
• vertical axis: absolute magnitude from about +15 at the bottom to −10 at the top, so brighter stars are higher
• horizontal axis: temperature from about 50 000 K on the left to 2500 K on the right, so temperature increases from right to left, and the scale is not linear (spectral classes O B A F G K M can be shown along the top)
Sign in free to see the rest of this lesson, the R.E.C.I.P.E. recall steps and the quiz
BrainCake is free. Make an account in seconds and pick up where this page stops.
More in Astrophysics
- Black-Body Radiation
- Wien's Displacement Law
- Stefan's Law
- Spectral Classes
- Evolution of a Star
- Supernovae, Neutron Stars and Black Holes
- The Schwarzschild Radius
- Type Ia Supernovae as Standard Candles
All 24 lessons in Astrophysics · All AQA A-level Physics topics