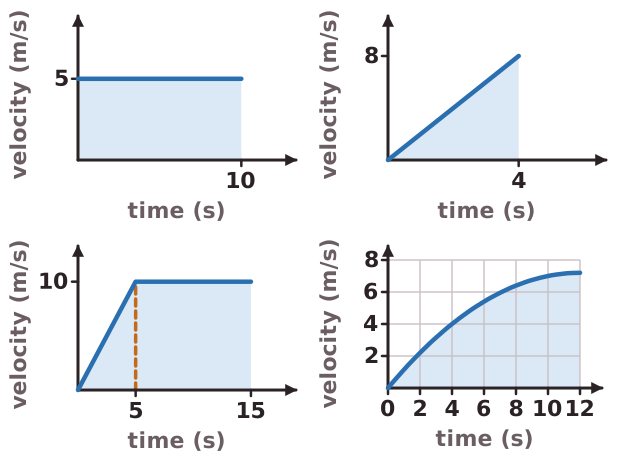
The area between a velocity-time line and the time axis equals the distance travelled. This works because distance = velocity × time, and the area of a rectangle is height × width, which here is velocity × time.
Split the shape into simple parts. Constant velocity gives a rectangle, so a car moving at 5 m/s for 10 s travels 5 × 10 = 50 m. A line sloping up from zero gives a triangle, with area half × base × height. A car accelerating from 0 to 8 m/s in 4 s travels ½ × 4 × 8 = 16 m. A shape with a sloping top is a triangle plus a rectangle, for example 0 to 10 m/s in 5 s then constant for 10 s: 25 + 100 = 125 m.
If the line is curved, count the squares under it. Work out the distance that one square represents by multiplying its width in seconds by its height in m/s, then multiply by the number of squares. Count part squares as halves or by combining them. Units are metres, because (m/s) × s = m. For example, accelerating from 0 to 8 m/s in 5 s gives ½ × 5 × 8 = 20 m. A cyclist at a constant 6 m/s for 10 s covers 6 × 10 = 60 m, but one who accelerates from rest to 6 m/s over those 10 s covers only ½ × 10 × 6 = 30 m.