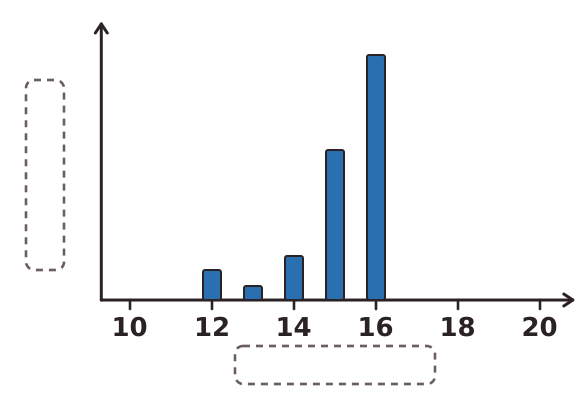
An instrumental method gives its result as a chart or a table of numbers. A mass spectrometer produces a chart called a mass spectrum. The horizontal axis shows the m/z value, which for the ions you meet at GCSE is simply the mass of the ion. The height of each peak shows the relative abundance, which tells you how much of that ion was detected.
The peak with the highest m/z value is the molecular ion peak. Its m/z value is equal to the relative molecular mass of the compound. The smaller peaks to the left of it are caused by fragments, which are pieces of the molecule that broke apart inside the instrument.
A result on its own tells you very little. You identify a substance by comparing it with a reference set of data in the same form. Suppose the reference table gives these relative molecular masses: methane 16, ethane 30, propane 44 and butane 58. If an unknown hydrocarbon gives a molecular ion peak at m/z 44, its relative molecular mass is 44, so it must be propane. The other values in the table do not match.