 BRAINCAKE
Integration Traces
The area under each peak in a 1H NMR spectrum is proportional to the number of hydrogen atoms in that environment. The spectrometer shows this as an integration trace: a line drawn across the spectrum that rises in a step at each peak. The height of each step is proportional to the area of the peak below it.
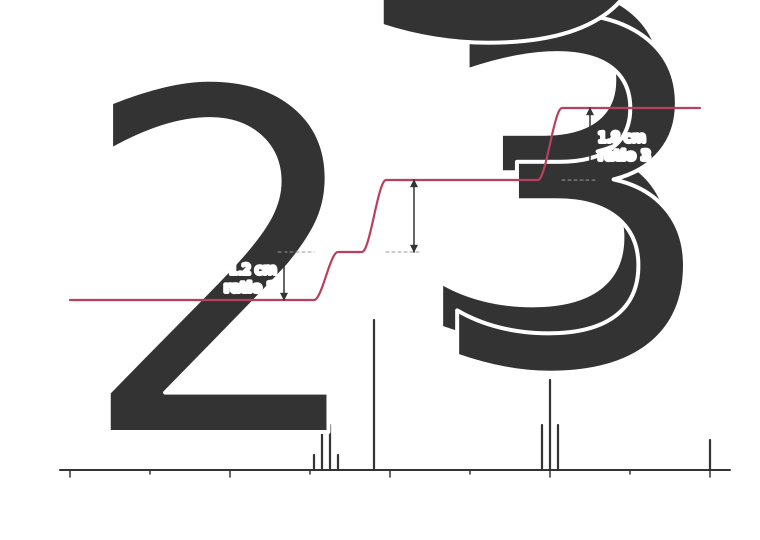
To use an integration trace:
1. measure the height of each step
2. divide each height by the smallest one and find the simplest whole-number ratio
3. compare with the molecular formula: the numbers in the ratio should add up to the total number of H, or a factor of it
Sign in free to see the rest of this lesson, the R.E.C.I.P.E. recall steps and the quiz
BrainCake is free. Make an account in seconds and pick up where this page stops.
More in Modern Analytical Techniques
- Retention Times
- Nuclear Magnetic Resonance
- Chemical Shift
- 13C NMR Spectroscopy
- 1H NMR Spectroscopy
- Spin-Spin Splitting
- The n+1 Rule
- Deducing Structures from Combined Data
All 15 lessons in Modern Analytical Techniques · All Edexcel A-level Chemistry topics