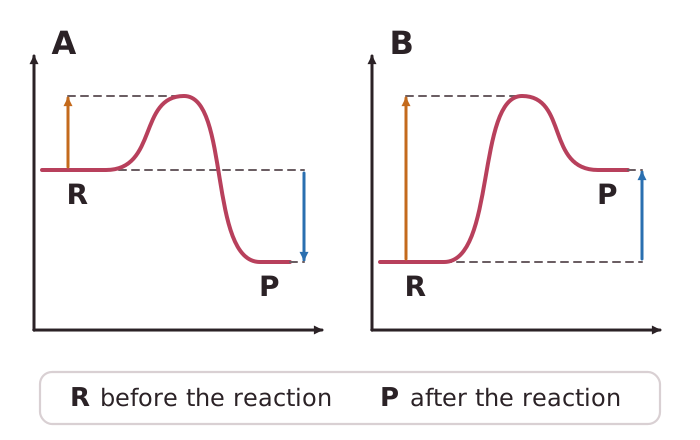
A reaction profile shows how the energy of the chemicals changes during a reaction. Energy is on the vertical axis and the progress of the reaction is on the horizontal axis. The reactants are drawn as a level line on the left and the products as a level line on the right.
In every profile the line rises from the reactants to a peak and then falls to the products. The energy gap from the reactants up to the top of the peak is the activation energy. It is labelled with an arrow pointing up from the reactants line to the peak.
For an exothermic reaction, the products are at a lower energy than the reactants. The overall energy change is the drop from the reactants down to the products, and it is labelled with an arrow pointing down.
For an endothermic reaction, the products are at a higher energy than the reactants. The overall energy change is the rise from the reactants up to the products, and it is labelled with an arrow pointing up.