Cooling curves correct for heat loss to the surroundings. The temperature of the reactants is measured at 30 second intervals until the temperature stays constant. The reactants are then added together and the temperature is measured every 30 seconds until the temperature has fallen for several minutes.A graph of temperature against time is plotted. To correct for cooling the curve is extrapolated back to the time the reactants were mixed together.
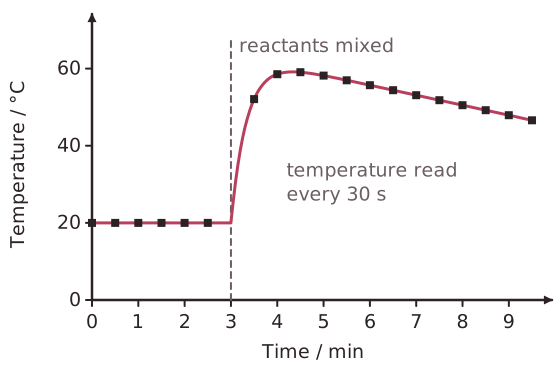
Cooling Curves
Read the text
Read the text and highlight anything you think is important. When you go on, the text is hidden and you answer from memory.
Specification: OCR Chemistry A (H032), AS-level, 3.2.1 Enthalpy changes. Topic: Enthalpy.
More in Enthalpy
- Enthalpy Change of Neutralisation
- Measuring the Enthalpy Change of Combustion
- Accuracy of Experimental Value
- Determining the Enthalpy Change of a Reaction
- Average Bond Enthalpy
- Calculating Enthalpy Changes from Bond Enthalpies
- Limitations of Bond Enthalpy Calculations
- Hess's Law
All 19 lessons in Enthalpy · All OCR AS-level Chemistry topics