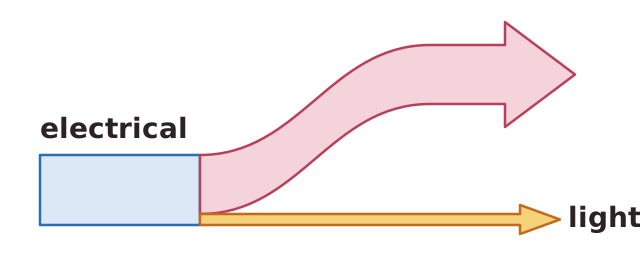
Energy transfer diagrams show how energy moves from one store to another. Each arrow joins two stores or devices and is labelled with the energy involved. For an electric kettle, energy moves from the electrical supply to the thermal store of the water. For a falling ball it moves from the gravitational potential energy store to the kinetic energy store.
A Sankey diagram adds numbers. The width of every arrow is drawn in proportion to the amount of energy it represents. The input arrow, showing the total energy supplied, is on the left. The useful output continues straight on. Energy that is not useful is called wasted energy. It branches away from the main arrow, and is usually transferred to the surroundings by heating.
To interpret one, remember that the useful and wasted arrows add up to the input arrow. A lamp with 100 J of input and 10 J of light has 90 J wasted as thermal energy. A motor with 50 J in and 35 J of useful output has 15 J wasted. If nothing is wasted, the output arrow is the same width as the input arrow, because energy is conserved. If 200 J of input is drawn 20 mm wide, every 10 J is 1 mm wide, so 50 J is 5 mm wide.